Reports as a Service
A deep dive into measuring what matters
Every other week I write an email discussing what I learn launching and growing Reboot Motion. If you would like to receive it directly in your inbox, subscribe below.
Biomechanical analyses are not annual physicals.
At Reboot, we believe in the power of continuous monitoring. For teams looking to get the most out of their athletes, the body is too complicated to rely on infrequent check-ins.
And for the athletes themselves? The ones constantly making tweaks and improving in the weight room?
They can’t come to the right conclusions with stale data.
Top performers need Reports as a Service.
—
This is the bet Reboot Motion is making as a company: By monitoring athletes 1) in-game and 2) in every game, we:
Individualize everything. Our reports are individual by nature. We never want to say “since a pitcher that throws hard does X, you should do X too”. Rather, we analyze how each individual moves and look for ways to optimize their specific motion.
Provide context. While each pitcher is unique, we understand context helps. We show population averages, allowing partner clubs to compare to a group they view as relevant- likely their own organization.
Send reports (at least) daily. Our baseline optimization reports are sent daily. In addition, partners regularly request comparison reports- where we can compare 1) two athletes 2) a single athlete to their average performance 3) a single athlete to a specific outing or outcome, and more.
Educate and empower. We understand the physics behind our recommendations and will sit down as often as needed to turn coaches and R&D teams into experts.
Momentum Based Biomechanics
Reboot Motion is built on the philosophy that analyzing momentum is superior to analyzing velocity, as it 1) controls for mass and 2) includes direction.
Our reports- which we break down into 5 sections outlined below- all circle back to the two core ideas mentioned above.
Sequence
The beginning of our report is similar to something most people are familiar with: the kinematic sequence.
The idea is that momentum gets to the ball or the bat in the following way: the athlete pushes on the ground and generates ground reaction forces. They then transfer that momentum through their lower half, their torso, their arms, and eventually the bat or the ball.
The most efficient way for an athlete to transfer that momentum is to have specific body parts reach their peak momentum in a specific order.
For a pitcher, this is rear leg → lead arm → torso → throwing arm.
And for a hitter, it is rear leg → torso → lead arm → bat.
(For those looking for confirmation- and if no one else is in the room- I recommend doing either motion and slowly focusing on each part of your body.)
Sequencing is important because, when an athlete starts to generate velocity with a specific body segment, that segment pushes against the one before it in the chain. An athlete will transfer the most momentum when the previous body part peaks prior to the next one beginning to rotate, as this creates the most energy to push against.
Sequence Pitching Example
For each section we will dive into two reports. One for a pitcher and one for a hitter.
Below, we see a pitcher who is out of sequence, most notably with their lead arm peaking too soon, likely leaving velocity on the table.
We generally find that aligning (we’ll get to alignment soon) a pitcher’s lead arm with their throwing hand will aid in velocity. However, for this pitcher, that may not work unless their sequence is tweaked as well. Since their lead arm peaks too early, it likely is not transferring much momentum to the torso, and eventually the pitching hand and the ball.
Sequence Hitting Example
We contrast that to the hitter below, who is moving in the correct sequence. There is little to take away here, other than noting that this is not an area that needs focus.
Rotation Planes
The rotation planes section is our personal favorite for understanding how an athlete moves, as well as our #1 spot to pick low hanging fruit.
If we remember from the previous section, the athlete’s goal is to transfer momentum from one body part to the next up the chain. The most efficient way to do so is to have the rotation planes of those body parts aligned.
Here, we ask two main questions:
What is the rotation plane of the body part we care about (the bat for hitters or the ball for pitchers)?
How well is the rest of the body aligned with the thing we care about- as that will aid in efficiency, and therefore velocity, bat speed, and performance?
Rotation Planes Pitching Example
To see why individualizing the report for each athlete is important, let’s take a look at two pitchers:
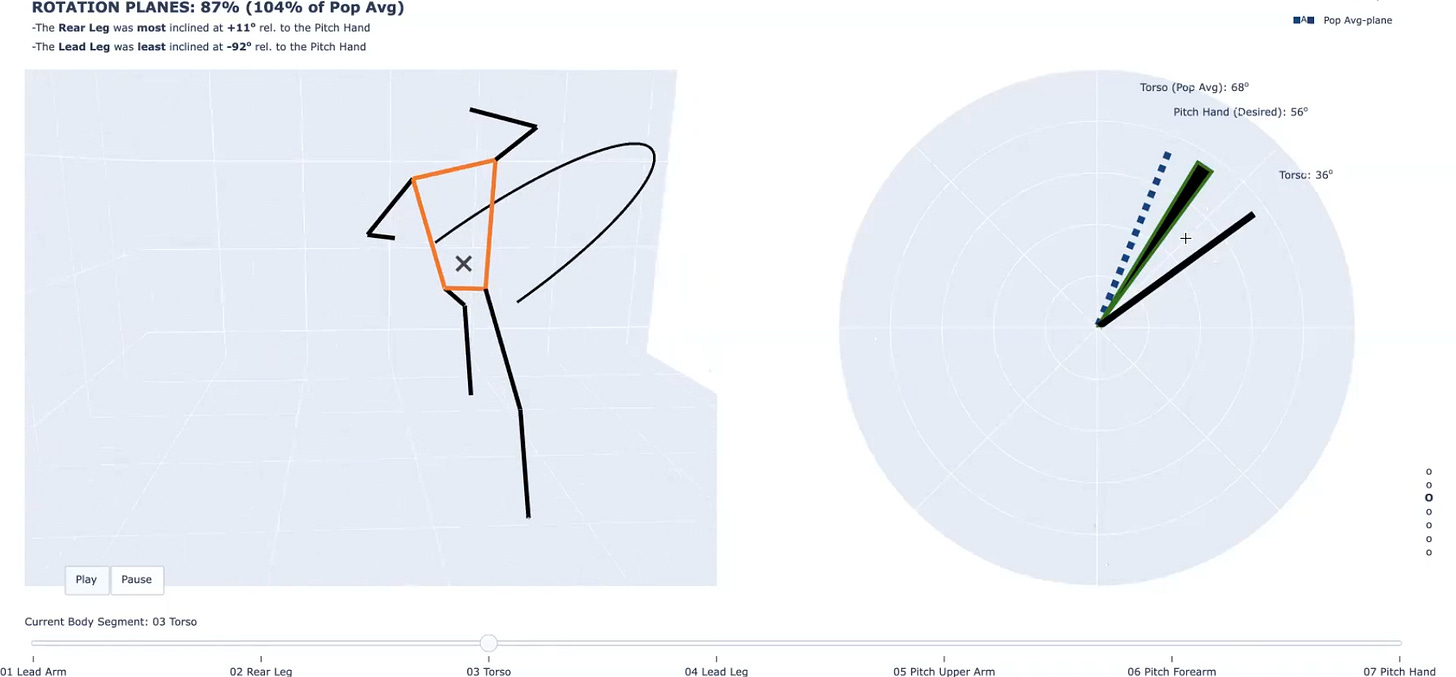
Our first pitcher has a fairly typical 3/4 arm slot, with the pitching hand at 56 degrees (90 would be vertical, 0 would be horizontal). We notice their torso is comparatively more horizontal, at 36 degrees.
To maximize alignment, we would want the pitcher’s torso to match their pitching hand at 56 degrees.
We contrast that with the next pitcher who has a much more vertical arm slot, at 84 degrees, likely producing great induced vertical break. Their torso rotation plane, despite being greater than the population average, is (from a pure physics standpoint) too low at 73 degrees.
Here, it would be up to the coach to decide what to do. It is very likely the extreme verticality of the pitching arm makes perfect alignment tough, and a coach wouldn’t worry too much about optimizing this specific metric.
However, we would absolutely want to steer clear of any attempt to reduce trunk tilt, no matter what “other elite pitchers do”, as it would reduce alignment between the torso and the pitching arm.
Rotation Planes Hitting Example
For the hitter below, we take the same two step process, starting with the athlete’s swing plane. This hitter is slightly more tilted, or slightly more negative (208 deg vs 203 deg), than the population average.
While that is interesting to note, what we really want to see is how well the hitter aligns the rest of their body with the bat.
Their lead leg- which can be thought about as the plane in which the knee rotates- is very well aligned with the bat at 212 deg.
For a more intuitive example, we can view the hitter’s torso rotation plane. Again, the hitter does a great job aligning their torso with the bat. We see their torso’s rotation plane is 206 deg vs the population average of 213. However, given the bat rotation plane, this hitter is only 2 degrees away from perfect alignment, while the population is 10 degrees away.
Momentum
The momentum section shows the momentum peaks for each body part. For those that are more comfortable thinking about peak speed or peak velocity, this is the same concept.
With that said, analyzing via momentum provides a couple major advantages:
Momentum allows for the coach to compare body parts, since adjusting for mass puts everything on the same scale.
More importantly, momentum accounts for direction. In other words, our metrics focus on acceleration that impacts ball velocity for pitchers and bat speed for hitters, because that is the acceleration they care about.
With this section, as well as the final section on ranges of motion, we think organizations can benefit from looping in the medical staff and strength staff to optimize player development.
For example, for an athlete generating below average momentum with a specific body part, the club can investigate further and learn if the problem is one related to force generating capabilities or technique. They can then create an organizationally aligned plan to attack the weakness and improve performance.
Momentum Pitching Example
For the pitcher below, we notice the momentum generated by their rear leg is a bit less than the population average. Right now, all we know is there is an issue we may want to address.
To figure out the root cause, we would recommend the strength & conditioning staff and coaching staff collaborate to determine the best path forward. The pitcher may lack power generating capacity with their rear leg, or they may be struggling to tap into it with their delivery.
Momentum Hitting Example
For the hitter below, we see the opposite. This hitter is generating an enormous amount of momentum from their torso- 152 mph vs a population average of 78 mph.
Unsurprisingly, this was the same hitter that had a tremendously aligned torso and bat. Not only does that alignment ensure all the energy created by the torso contributes to bat speed, it also aids in transferring that energy to the lead arm and eventually the bat.
Balance
Balance is another section where momentum’s ability to account for direction shows up, allowing us to decipher between the force generated 1) in the direction the athlete cares about and 2) elsewhere.
For a pitcher, we generally focus on the momentum produced towards home plate, while for a hitter, we care about the momentum created back towards the field.
Remembering back to the rotation planes section, there are multiple planes an athlete can rotate around. We can generalize these with three main axes:
First, the athlete can rotate around an axis that's parallel to the pitching rubber- which is the primary axis a pitcher with an overhead slot would rotate around. We can visualize this as rotating like a Ferris Wheel.
Second, the athlete can rotate around an axis that's through their spine- which mirrors a sidearm delivery. We can visualize this as rotating like a merry-go-round.
Finally, the athlete can rotate around a third axis- one from the rubber towards home plate. Here, we can visualize the pitcher or hitter on a balance beam.
Rotating around either of the first two axes, or anywhere in between (ex. 3/4 arm slot), will generate velocity towards home plate for a pitcher or towards the field of play for a hitter.
For this section, and this section only, we are focusing on the balance beam- the one axis that does not generate the velocity pitchers and hitters alike are after.
In an ideal world, the most efficient thing would be to generate no momentum in the third axis. However, accomplishing this in any athletic task is nearly impossible. And for hitters who are reacting to a 90+ mph spinning baseball with an unknown location, this is especially true.
Balance Pitching Example
The first thing we notice with the following pitcher is they are generating lots of lead leg momentum towards first base, which is not contributing to velocity. This is what many coaches may refer to as falling off, and could be an easy opportunity to redirect momentum towards the plate to increase velocity.
Balance Hitting Example
And for the hitter below, we notice more than 50% of their rear leg momentum is generated off-plane in the third base direction.
While that sounds bad at first glance, it is worth noting a few things:
It is better than the population average, which should provide some context and comfort.
More importantly, hitting is a reactionary endeavor. Some of what is measured as a lack of balance may be a hitter lining up a pitch to aid in making contact.
Overall, this is an area where we want to be careful and use our data as just one input in a larger coaching decision. It is possible a hitter regularly falls victim to diving over the plate or falling off towards the dugout. However, they also may be making key adjustments as they gain information on pitch location.
This is true for pitching as well, where movement along the third axis could aid in deception, as pitchers move from rotating in a vertical plane to a horizontal one, or vice-versa.
Ranges of Motion
Finally, we have our ranges of motion section, where we show 1) the joint angle trace over time and 2) the ranges of motion used.
When looking at the visuals, our focus is on two things:
First, the total range of motion that we see over the course of the delivery or the swing- which is shown via the white bar.
Second, the range of motion the player uses in the appropriate kinematic sequence, highlighted by the darker, shaded area.
Ranges of Motion Pitching Example
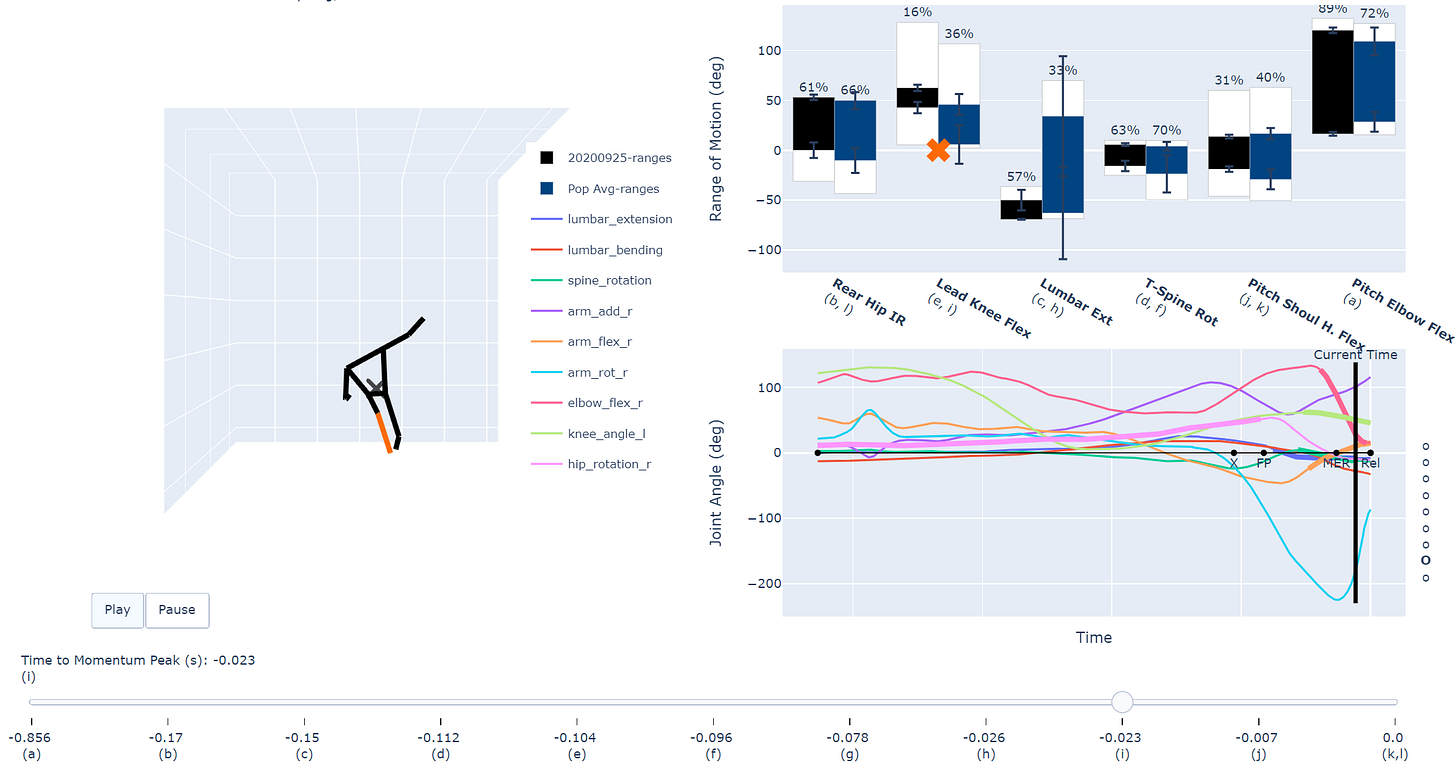
For the pitcher below, we immediately notice they are using a small amount of several ranges of motion. In particular, we notice they are using a fraction of the pitching shoulder horizontal flexion range of motion relative to the population.
At this point, we could loop in the medical staff to assess whether there is a restriction they could work on, or if it is a technique issue the coaches could improve with drills or cues.
Ranges of Motion Hitting Example
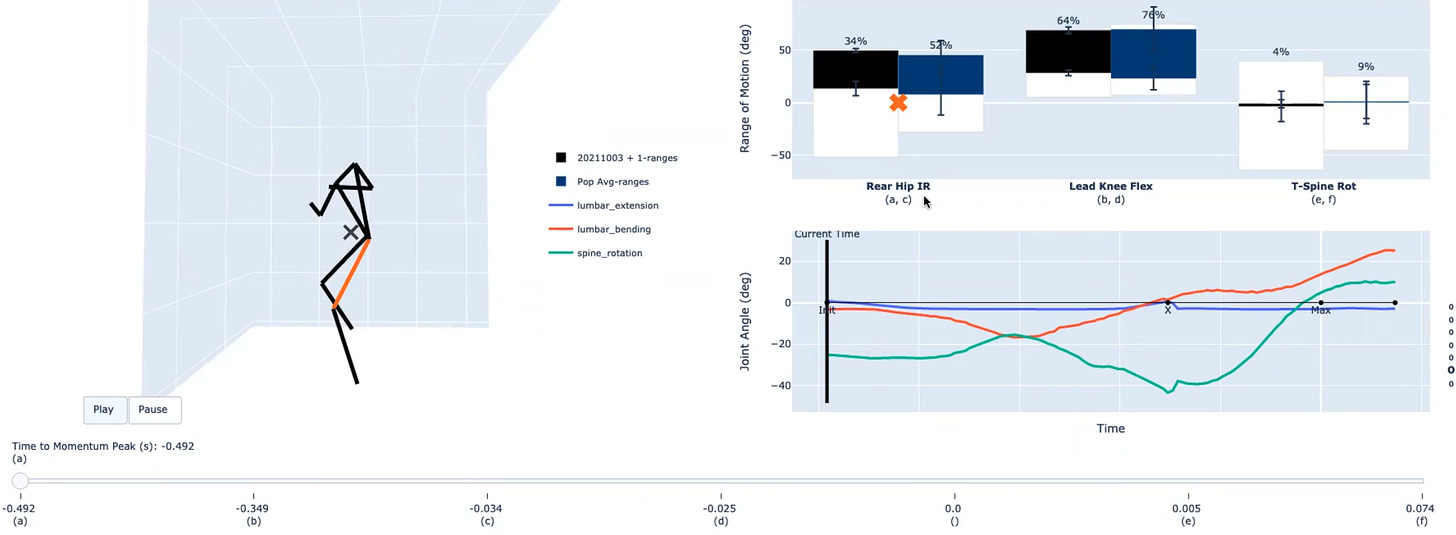
We see a similar story with the hitter below. Here, their rear hip IR is greater than the population average. However, they are only using a small percentage of it.
We would again recommend looping in the medical staff to best diagnose the issue.
Closing Thoughts
Reboot Motion believes coaching is both an art and science. At Reboot, we are laser focused on the science:
Making momentum based biomechanics the default method to analyze movement
Delivering the full picture of how an athlete moves- not simplifying things down to a single metric.
Providing the coaches with x-ray vision 1) in-game and 2) in every game.
We are convinced the world’s best coaches will mesh the science we deliver with the art they know so well, and help athletes perform better.
And that can only be done by measuring what matters.


