Building on Top of Reboot Motion: Derek's Recommendation Engine
Every other week I write an email discussing what I learn launching and growing Reboot Motion. If you would like to receive it directly in your inbox, subscribe below.
Reboot Motion helps others help athletes move better.
I repeat our favorite tagline all the time. And I regularly give the follow up that, as of today, most of the time we are specifically helping coaches help athletes move better.
However, our long-term goal is to also be a platform for data scientists, biomechanists, and tech companies to build on top of.
This post is a step towards that goal and evidence of what can happen when smart, curious people get a hold of brand new data.
Background
For background on what is to follow, a few months ago Reboot hired Derek Bivona, a Postdoctoral Research Associate at the University of Virginia (UVA) who received his PhD in Biomedical Engineering from UVA, as a data science consultant.
We gave him the following open-ended prompt: Reboot Motion has mountains of proprietary data. Can you help us find better ways to turn insight into action?
A lot of the work Derek did will stay with us as we build our recommendation engine, RebootAI.
But some of it we wanted to share.
Before getting to Derek’s work, there are a few ideas I want to highlight:
Everything you’re about to read is from Derek. While we were in contact throughout and agree with most things, there are decisions and takeaways that likely would’ve been done different if done by Reboot.
And that’s the point!
We expect different people to attack the problem of turning data into action differently. Each of our MLB partners has a different viewpoint on how best to develop talent, and we expect them to keep that proprietary.While our reports do a lot, they just scratch the surface on what teams can do when measuring what matters. Our goal is to take our partners 80% of the way there, and let them focus on the final 20% that most impacts winning
Derek is a worker. If any pro team or tech company is looking for help, he is someone that will execute.
Without further ado, here is Derek’s recommendation engine:
Derek's Recommendation Engine
By: Derek Bivona
Overview
Reboot Motion has expertise in momentum-based modeling as their Biomechanics as a Service tool is used by 30% of MLB clubs, along with colleges and academies.
With the success of analyzing countless pitches and swings from players at all levels comes a plethora of data well suited for statistical modeling.
Reboot is interested in taking this data and using machine learning to predict pitcher specific velocity improvement.
Specifically, Reboot wants to answer:
How can pitchers improve velocity short-term (in-season)? AND
How can they do so long-term (during the off season)?
Both of these questions are answered by looking at pitcher specific models, which incorporate the larger population and the specific pitcher.
A Workflow to Generate Pitcher-Specific Advice To Improve Fastball Velocity
Step 1. Pre-Processing the Available Data
Available Data
Reboot Motion has previously analyzed the delivery of more than two million pitches. A subset of pitches identified as fastballs were used to generate the models necessary for pitcher-specific advice. Overall, approximately 12,000 de-identified fastballs- each with around 70 biomechanics-based, proprietary parameters (also referred to as the “features”)- were utilized to build the workflow.
Data Pre-Processing
Our initial step involved pre-processing the available data. After missing values were replaced with the median of the given feature, correlations were examined among all features to identify collinear variables that could harm the model.
Twenty pairs were identified as highly correlated (the absolute value of the correlation coefficient was > 0.8). These pairs are shown in the table below, and the bolded parameter in each pair was identified as more actionable by Reboot’s CEO, Jimmy Buffi, and kept in the dataset for analysis.
While this specific dataset was used in constructing the model that finds the general relationship between the biomechanics-based parameters and fastball velocity (see Step 3. Velocity Improvement: Long-Term Adjustments), the same logic was used for the pitcher-specific model.
Step 2. Velocity Improvement: Quick Fixes
Linear Regression
The second step involves developing a model that 1) considers a given pitcher’s current, most common motion and 2) identifies aspects of the pitching delivery that can be quickly adjusted to improve fastball velocity.
(For context, we are looking for movements we know the pitcher can do with high variance for that pitcher. Our hypothesis is these tweaks are easier to make in-season.)
The model chosen for this task was linear regression, which is one of the simplest, yet most useful machine learning models due to its ease of interpretability and cheap computational cost. Additionally, it was assumed that the data used as input into this segment of the workflow originates from a single outing on the mound during a game or bullpen session, during which the number of pitches may range from 50 to 100. With such a small number of observations, linear regression is the most appropriate, yet still powerful, tool that derives a relationship between the biomechanics-based features and velocity while avoiding overfitting since the number of parameters within the model can be controlled.
More specifically, a stepwise linear regression, which uses an iterative approach to add and remove variables in a linear model based on certain significance thresholds, was implemented to determine the best combination of parameters.
Output
Once trained, the stepwise linear regression model takes pre-processed mo-cap data from a specific pitcher and:
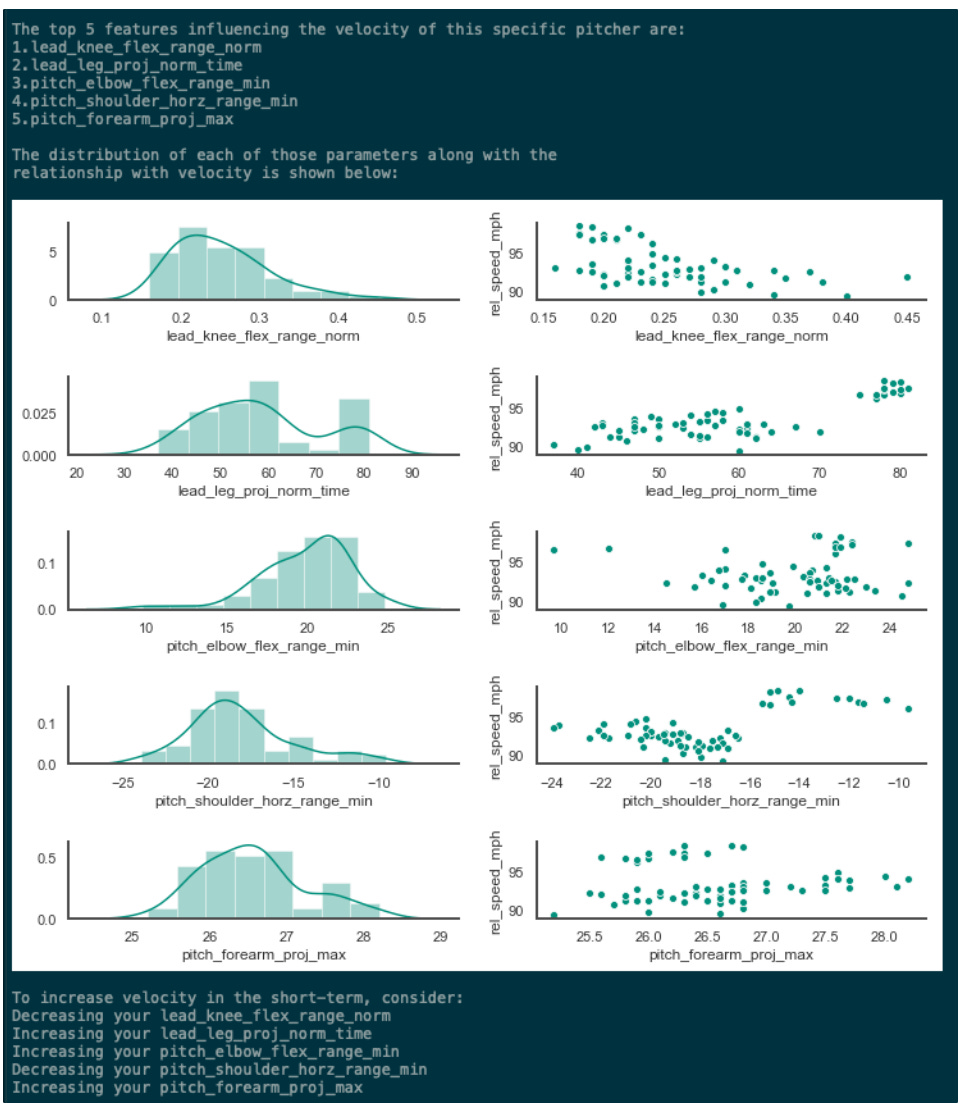
Identifies the top five features that influence the velocity of the given pitcher (Figure 1A),
Displays 1) the distribution of each of the significant parameters during the outing, as well as 2) scatterplots that mark parameter values versus fastball velocity (Figure 1B), and
Outputs advice on whether to increase or decrease a certain parameter in order to increase velocity (Figure 1C).
As expected, these results vary from pitcher to pitcher.
For example, data from a different pitcher is used in Figure 2, and thus the advice is different from that in Figure 1.
Figure 1A. List of top five features influencing velocity of specific pitcher.
Figure 1B. Distribution of each of the significant parameters as well as scatterplots on which the parameter values are plotted versus fastball velocity.
Figure 1C. Pitcher-specific advice to increase fastball velocity.
Figure 2. Quick fixes for a pitcher different than that in Figure 1.
The model suggests Pitcher 1 is best off increasing ‘lead_arm_vert_ang’ (or at least keeping it within the range of 30º to 35º), while Pitcher 2’s most impactful change is to decrease ‘lead_knee_flex_range_norm’ (or at least keep it within the range of 0.2 to 0.3).
Finally, one of the most exciting future directions of this model involves identifying fatigue. By simply shading the dots to correspond to pitch count number within Figure 1B, it may be possible to recognize signs of fatigue.
Step 3. Velocity Improvement: Long-Term Adjustments
The final step involves constructing a model that finds the general relationship between movement metrics and fastball velocity to suggest long-term delivery adjustments.
Elucidating the general relationship between fastball velocity and features (biomechanics data) requires the integration of all available data as well as the use of more complex machine learning models. Therefore, tree-based models were utilized to regress fastball velocity from the biomechanics-based parameters using the data set of 12,000 fastball observations.
Tree-Based Machine Learning Models: General Fastball Model
In prior work, random forest and xgboost models (two types of tree based models) were optimized to fit the available fastball data. Briefly, the hyperparameters of each model were tuned such that the generalizability of each model was sufficient (i.e., the error between the training and validation splits throughout five-fold cross-validation was minimized and similar between splits).
Once the models were optimized and trained, the most important features- and their relationships with fastball velocity- were examined. Biomechanists at Reboot identified eight of the most actionable parameters, and the relationships between those parameters and velocity are shown in Figure 3.
Partial Dependence Plots: Relationship Between Parameters & Velocity
Figure 3 illustrates the partial dependence plots, or PDPs, generated from the optimized random forest model. Partial dependence plots show the marginal effect one feature has on the predicted outcome of a machine learning model, and can show whether the relationship between the target and a feature is linear, monotonic, or more complex.
With the optimized random forest, a model is available that theoretically predicts fastball velocity using the biomechanics-based features as input. Changing one feature (i.e., ‘pitch_hand_vert_ang’) in the model, while holding the others constant, demonstrates how perturbations of that given feature affect fastball velocity.
Figure 3. Partial dependence plots (PDPs) showing the relationships between eight actionable features and fastball velocity
From Figure 3, the following conclusions about each of the important features can be drawn:
‘pitch_hand_vert_ang’ - Arm slots ranging between 30º and 40º exhibit the highest velocities.
‘torso_vert_ang_align’ - Highly aligning the torso and the pitching hand produced maximum velocities. This variable seems to be binary: if it is greater than 0.9, the athlete throws harder than if it is less than 0.9.
‘lead_knee_flex_range_min’ - Higher velocities are achieved when there is a more minimum value in the lead knee flexion (or bend).
‘spine_rot_range_full_max’ - Less spinal rotation results in a more efficient delivery and better velocity.
‘total_vert_ang_align’ - Overall rotation plane alignment results in throwing harder.
‘total_proj_max’ - The athlete’s peak momentum drives velocity.
‘rear_leg_vert_ang’ - Velocity increases nearly linearly with rear leg vertical angle.
‘lead_arm_vert_ang' - The vertical angle of the lead arm variable seems to be binary: if it is less than 25º, the athlete throws harder than if it is more than 25º.
Output
With the development of a general model, long-term adjustments in delivery can be suggested after finding where a given pitcher falls short with respect to each of the eight parameters.
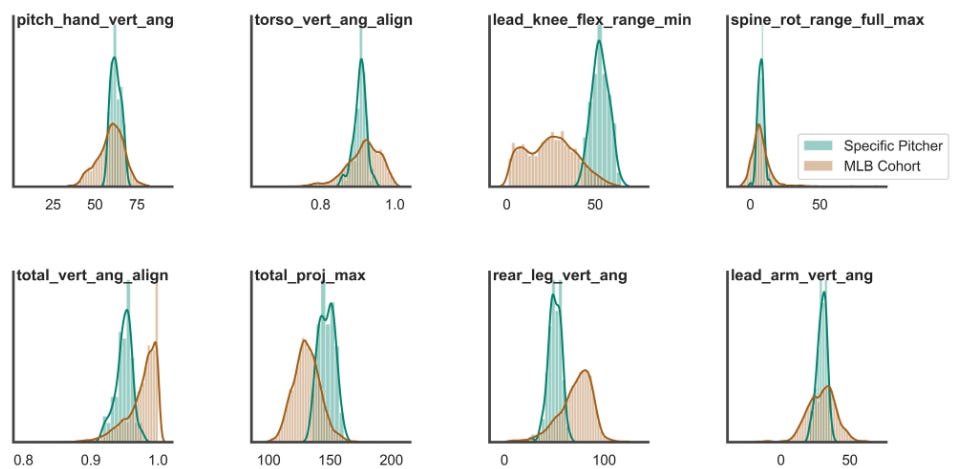
To do this, the distribution of the parameters of a specific pitcher (here, from Figure 1) are overlaid on the distribution of the same parameters from the MLB cohort as shown in Figure 4. The ranges of these parameters are also highlighted on the PDPs as shown in Figure 5.
Figure 4. Distributions of the eight most actionable and significant biomechanics-based features that drive velocity. The distributions in green are those from a specific pitcher whereas those in brown are from the MLB cohort.
Figure 5. PDPs, with the ranges of features from a specific pitcher highlighted in green, showing the relationships between eight actionable features and fastball velocity
Finally, deviations in the means of the parameters between the specific pitcher and MLB cohort are calculated to determine which parameters are best to adjust in the long-term in order to improve fastball velocity while the ML model and PDPs suggest how to adjust each parameter.
(The theory is long-term adjustments are things the pitcher has shown less evidence of being able to do. These are fixes that may take time with a pitching coach, in the weight room, etc.)
An example output is shown in Figure 6. Notice how the advice for quick fixes in Figure 1C are different than the long-term advice given in Figure 6.
Figure 6. Long-term advice to increase velocity
Conclusion & Limitations
Conclusions
In summary, Reboot Motion’s proprietary movement metrics can be used to deliver player-specific advice to improve fastball velocity. The workflow is defined in three steps:
The pitcher-specific data, input as an M row x N column matrix where M is is the number of fastballs and N is the number of features plus recorded fastball velocity, is first pre-processed.
Next, the workflow identifies areas of quick fixes in a pitcher’s delivery after learning the features of the given delivery that most significantly drive velocity.
Finally, it pinpoints where the current pitcher falls short with respect to a given MLB cohort and suggests more long-term adjustments in delivery based on a general predictive model.
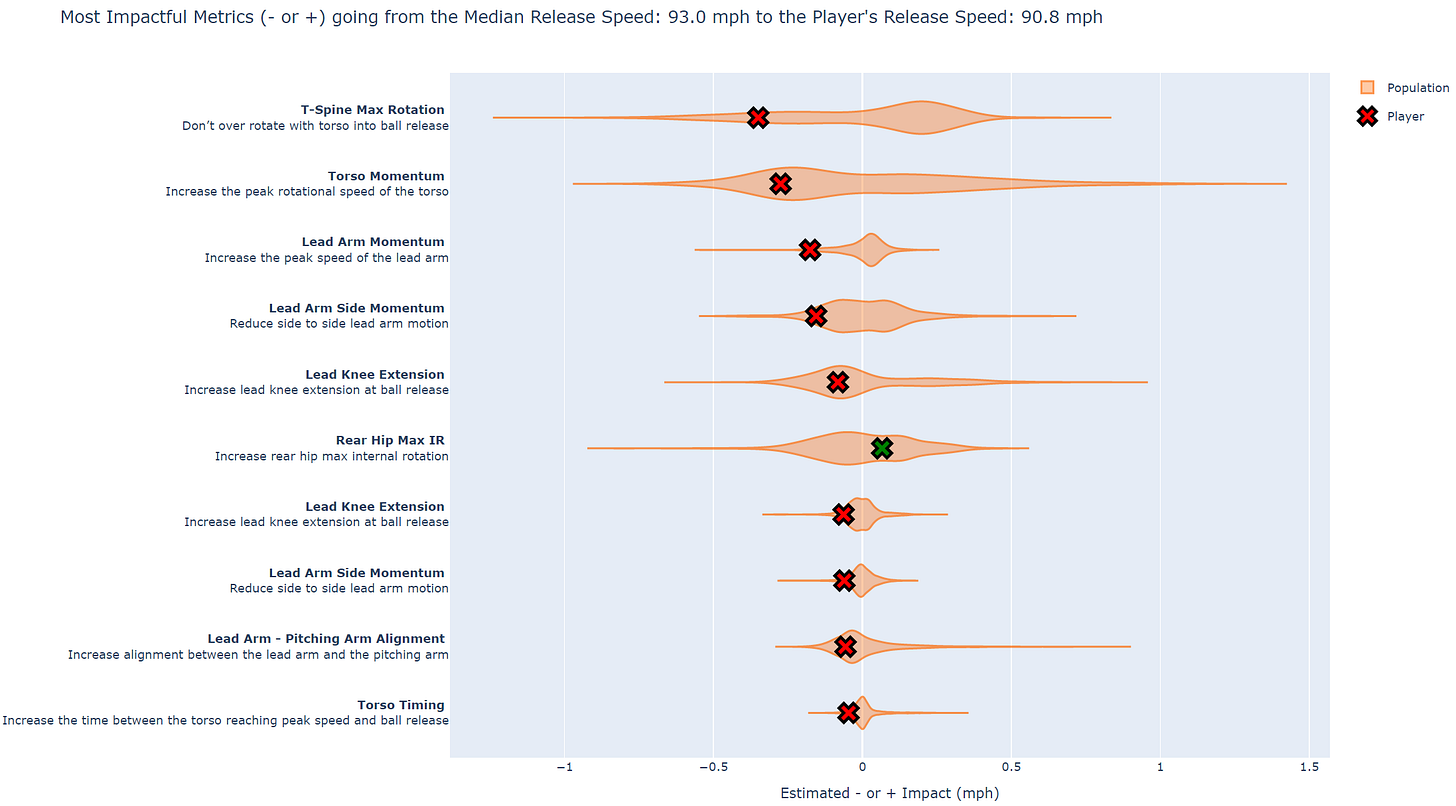
Below are links to two example reports generated for two pitchers, showing different, pitcher-specific suggestions for improving fastball velocity:
Limitations
While the preceding workflow is promising, there are some limitations that must be recognized, specifically centered around the data used as inputs.
First, this data only includes MLB players. Ranges of parameters and velocity may be limited in this population due to the efficient nature of professional pitchers; therefore, data from college and high school athletes may reveal stronger relationships between biomechanics and velocity.
Second, the received data included all types of pitches - not just fastballs. A crucial step was selecting only fastballs to be used in the analysis. While a pitch may be labeled as a 4-seam fastball, it could be incorrect. Reboot’s own Jimmy Buffi personally selected the pitches that were used in the workflow, so this limitation is of lesser concern.
While the aforementioned limitations should be recognized, it is unlikely that they alter the conclusions from this work.
This work, while on its own delivering player-specific advice to improve fastball velocity, can be expanded to give specific advice for: increasing induced vertical break, increasing exit velocity during hitting, and recognizing signs of fatigue.
This engine will be a tool that helps others help athletes move better.


